A script to analyse the impact of inflation on my loan.
Posted September 25, 2022 by Victor Sonck ‐ 4 min read
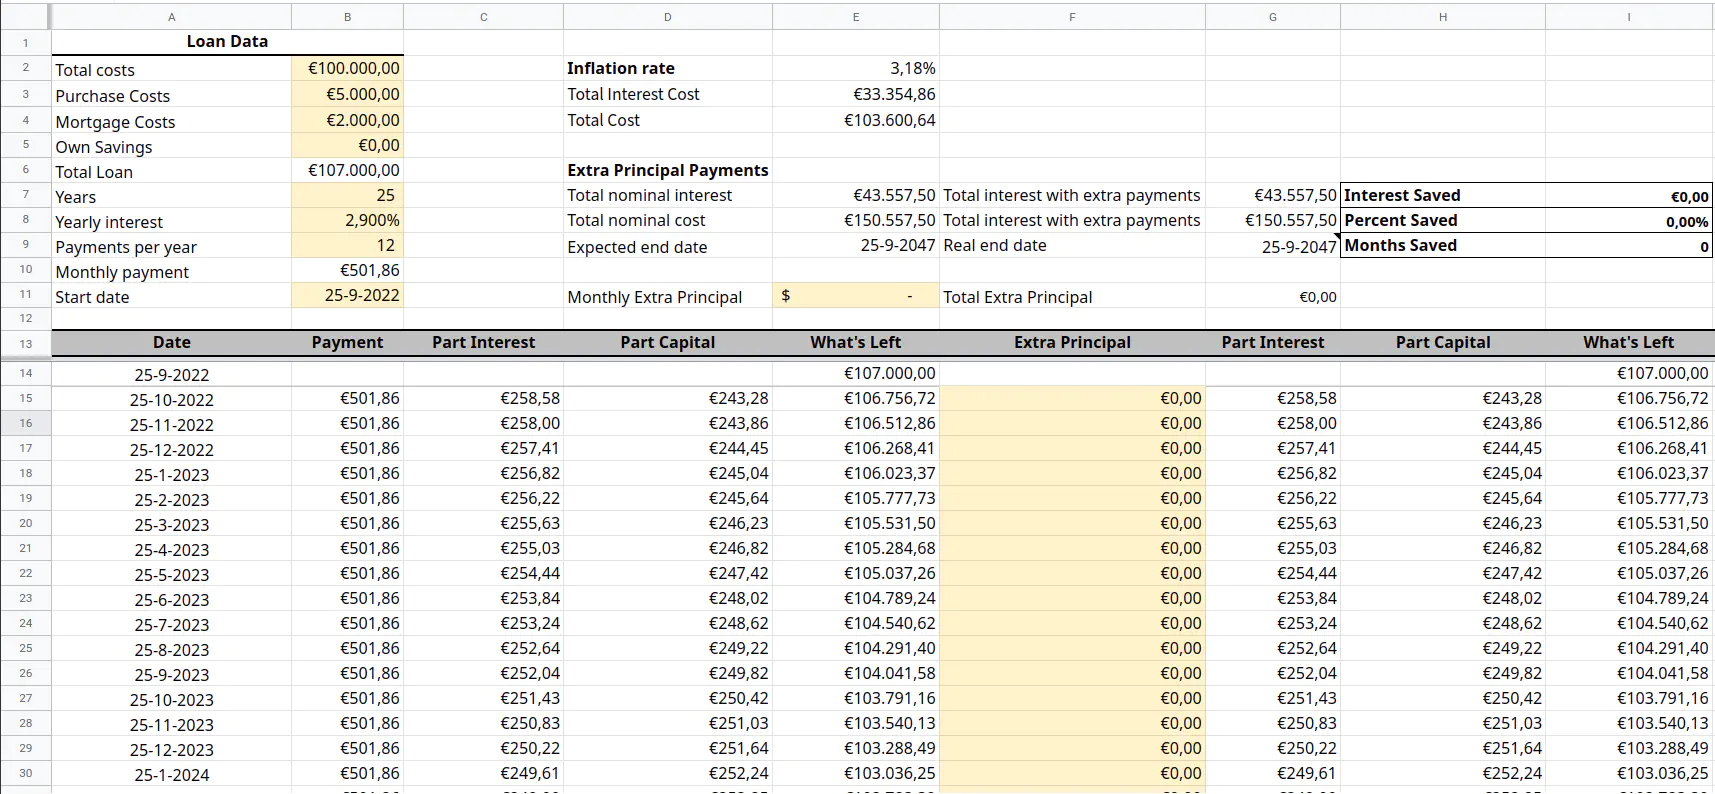
Simulating a loan in Google Sheets
Like so many others I’m now in the phase of my life where I’m thinking of buying a house. If you’re like me, you have already googled for excel templates on loan payment simulation. It’s the only way I know of to keep up with the salesy and overwhelming world of banks hungrily drooling to get your money already. Wading through the SEO optimized nonsense articles, I procured a simple google sheets template, but it was fairly basic so I extended it.
All numbers are fictional.
Adding inflation
The main choice here was whether to get a 20 year or 25 year period loan. Inflation plays a big role over that sort of timeline, so we want to account for it. To the chagrin of the excel masters, I don’t like the financial built-in functions. I prefer to have everything very verbose, and with normal equations, because when I make a mistake like that it’s usually easier to spot.
Calculating inflation is quite easy:
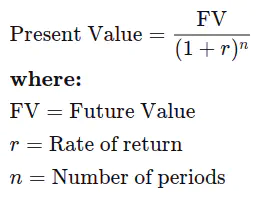
So we need the future value, the rate of return and the number of periods. In our calculation here the future value is just the monthly payment, the rate of return is the inflation percentage of our choosing and the number of periods is the amount of years from now.
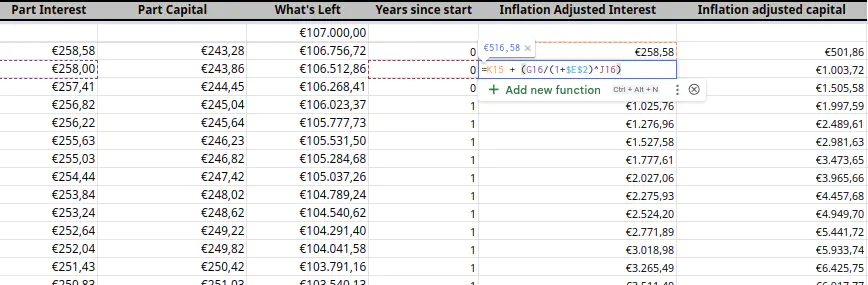
The first column is the amount of years since the start, we can get that with this formula:
# Current cell year - Fixed starting date
=YEAR(<current_cell>)-YEAR($<fixed_start_date>$)
Then we can inflation correct both the interest and the capital payments. I kept them split up so I can easily sum each, because the interest is the actual cost I want to know it separately.
# Basically the PV equation from above
=<previous_payment_cell_above> + (<current_payment> / (1+$<fixed_inflation_rate>$) ^ <years_since_start_cell>)
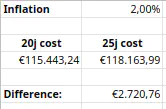
Immediatly the importance of this adjustment becomes clear when we sum up the adjusted costs. The nominal cost in this fictional scenario is €150.557,50 but this is “just” €118.163,99 worth in today’s euros under an inflation of 2%.
Adding an automation script
This made me wonder though, can I simulate a bunch of different inflation percentages and plot them out? In that case I’d be able to find the crossover point: for which % inflation a 25y loan becomes cheaper than a 20y one. And you can: Google Sheets has Apps Scripts, which is basically javascript with an easy SDK to access cells and manipulate them: fun fun fun!
First, though, we make an inflation meta-tab in Google Sheets.
Essentially, now I have 2 copies of the master payment table, one for 20y and one for 25y. Each one of them adjusts their payments using the inflation nr from the meta-sheet. Each of those sheets then run their complete calculation and report the total cost adjusted for inflation, which is then referenced in the meta-tab. Now we have made ourselves a little dashboard. Change the inflation and get the new total cost numbers!
Which means we can now write a script that tests a whole bunch of options for us and creates a graph in the process!
function myFunction() {
  // Get the sheet itself first
  var sheet = SpreadsheetApp.getActiveSheet();

  // Remove the previous table
  sheet.getRange('D4:F1000').clearContent();

  // Get the inflation cell
  var inflation_cell = sheet.getRange("B1");
  var result_cells = sheet.getRange('A4:B4');
  var graph_range = sheet.getRange("E4:F4");
  var graph_inflation = sheet.getRange('D4');

  // Set the iflation in a loop
  for (inflation_percentage = 0; inflation_percentage < 0.1; inflation_percentage += 0.001) {
    // Set the content of the inflation cell itself
    inflation_cell.setValue(inflation_percentage);

    // Read the resulting values
    result_values = result_cells.getValues();

    // Copy them to the table
    graph_range.setValues(result_values);

    // Also set this iteration's inflation so we can plot it later
    graph_inflation.setValue(inflation_percentage);

    // Move the result range for the next iteration
    graph_range = graph_range.offset(1, 0);
    graph_inflation = graph_inflation.offset(1, 0);
  }
}
From this graph we learn than the cutoff point is: 3.18% inflation. If inflation turns out to be lower than that and it will be cheaper to go for the 20y loan, else the 25y loan will be cheaper instead. Given the historic inflation I’m inclined to think an average inflation of 3.18% is unlikely, but that is your call. You could even factor in the difference you’d get when investing the difference in monthly payment for 25 years vs the full amount for only the last 5 to get an even better picture of the total cost.
The sheet
Of course you can get a copy of this sheet here!